Wufoo
Building a Report
Reports allow you to visually display the data you collected through your form and share the results with others. In order to create a report, you must have an existing form.
Building Reports

- Creating a Report
- Report Settings: Title, Description, and Export Setting
- Select Data: Choosing a Form and All Entries vs. Selected Entries
- Select Data: Creating Conditions to Filter Report Data
- Widgets: Adding Widgets & Widget Settings

Layout and Theme
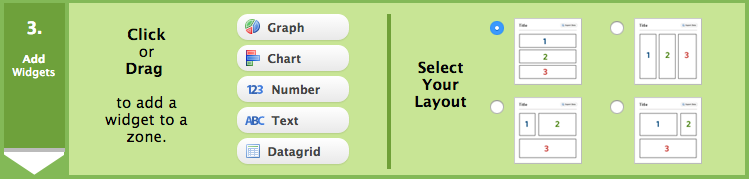
In the Add Widgets tab, you can choose from four different layouts that let you arrange your widgets into three zones. Within each zone, you can drag and drop your widgets in whatever order you want.
To change the logo, colors, fonts, and background of your report, you can apply the same theme you used for your form. You can select the theme for a report from the Report Manager.
Previewing, Sharing, and Downloading Reports

- Previewing a Report
- Sharing a Report
- Downloading a Report
- Why doesn't my report show any data?